





Coffee Association of America and the Golden Cup extraction theory
Golden Cup extraction uses two figures, concentration and extraction yield, to judge whether a cup of coffee was properly extracted. The SCAA range now recognized is 18% to 22% extraction yield and 1.15% to 1.35% concentration. The values are a reference tool rather than an absolute formula, and the article explains why brewers should not be confined by them.
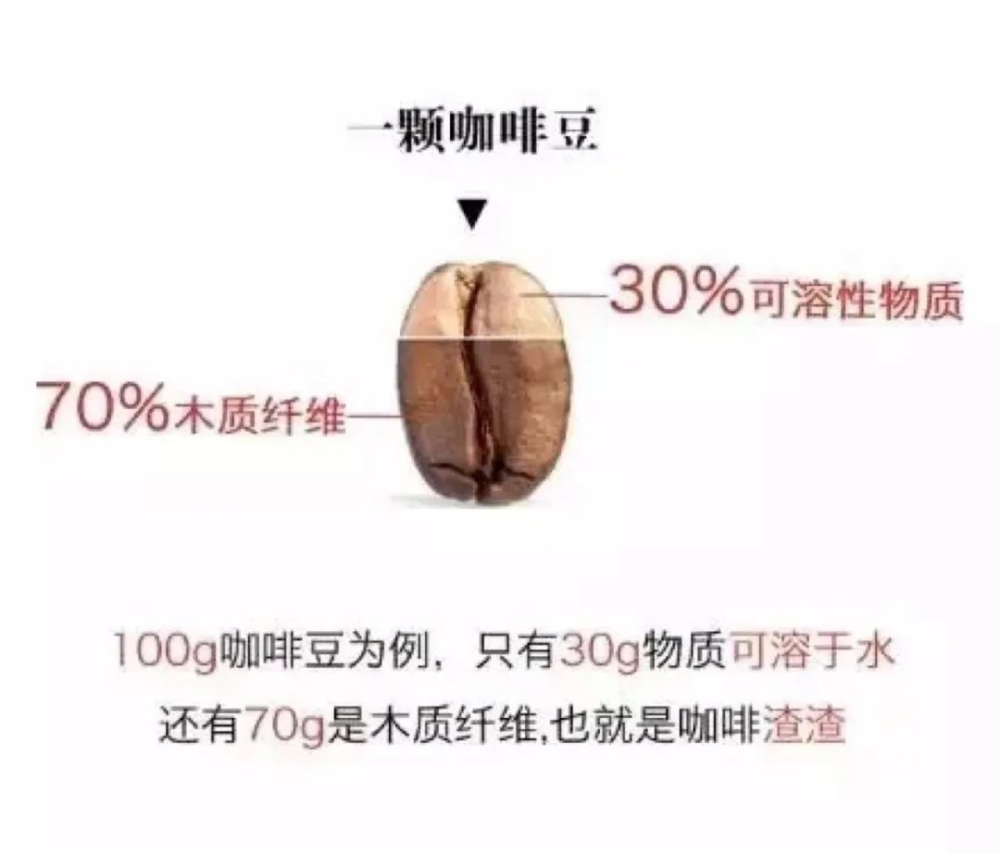
The theory began in the United States in 1952, when the coffee association of america worked with Dr. Lockhart of MIT and set up a Brewing Committee. Research found roughly 30% of a coffee bean is soluble and 70% is insoluble fiber. Early survey-based ranges were 17.5% to 21.2% yield and 1.04% to 1.39% concentration, with coarse grind and 4 to 8 minute extractions.
The Golden Cup extraction is a concept frequently mentioned in the coffee world. It uses two indicators—concentration and extraction yield—to determine whether a cup of coffee has been properly extracted. This theory can be traced back to 1952, when it was developed through collaborative research by the American Coffee Association and Dr. Lockhart of MIT. After multiple revisions, the Golden Cup range currently recognized by the SCAA is: extraction yield of 18%–22% and concentration of 1.15%–1.35%. However, the Golden Cup values are only a reference tool, not an absolute formula for brewing delicious coffee. This article will walk you through the origins and development of Golden Cup extraction, the meaning of concentration and extraction yield, how to calculate extraction yield using formulas, and why you should not be confined by the Golden Cup range.

Golden Cup extraction, simply put, uses two data points—concentration and extraction yield—as benchmarks to measure whether a cup of coffee has been fully extracted. The currently accepted Golden Cup values are: extraction yield between 18% and 22%, and concentration between 1.15% and 1.35%.
This theory originated in the United States in 1952. At that time, the American Coffee Association teamed up with Dr. Lockhart, a chemistry Ph.D. from MIT, to conduct systematic research on the coffee industry and specifically established a Brewing Committee. Dr. Lockhart's team conducted an in-depth analysis of the structure and chemical composition of coffee beans, ultimately concluding that about 30% of coffee beans consists of soluble substances, while the remaining 70% is insoluble fibrous material.

With this discovery in hand, they immediately took action, randomly surveying the American public about their coffee preferences. Based on the survey results, the extraction yield range was summarized as 17.5% to 21.2%, and the concentration range as 1.04% to 1.39%—this was the original Golden Cup extraction range. However, at that time, pour-over coffee was not prevalent in the United States, so the tests used coarser grind particles and considerably high water temperatures, with extraction times lasting 4 to 8 minutes. It is evident that back then, both the people and the coffee involved had significant variables.
Afterward, professional organizations conducted several more rounds of rigorous verification and invited experts to repeatedly taste and evaluate, ultimately revising the Golden Cup value ranges: the extraction yield was raised to 18%–22%, and the concentration was adjusted to 1.15%–1.35%. This version was recognized by the Specialty Coffee Association of America (SCAA) and has been in use ever since. At this point, some may ask: what exactly do concentration and extraction yield refer to?
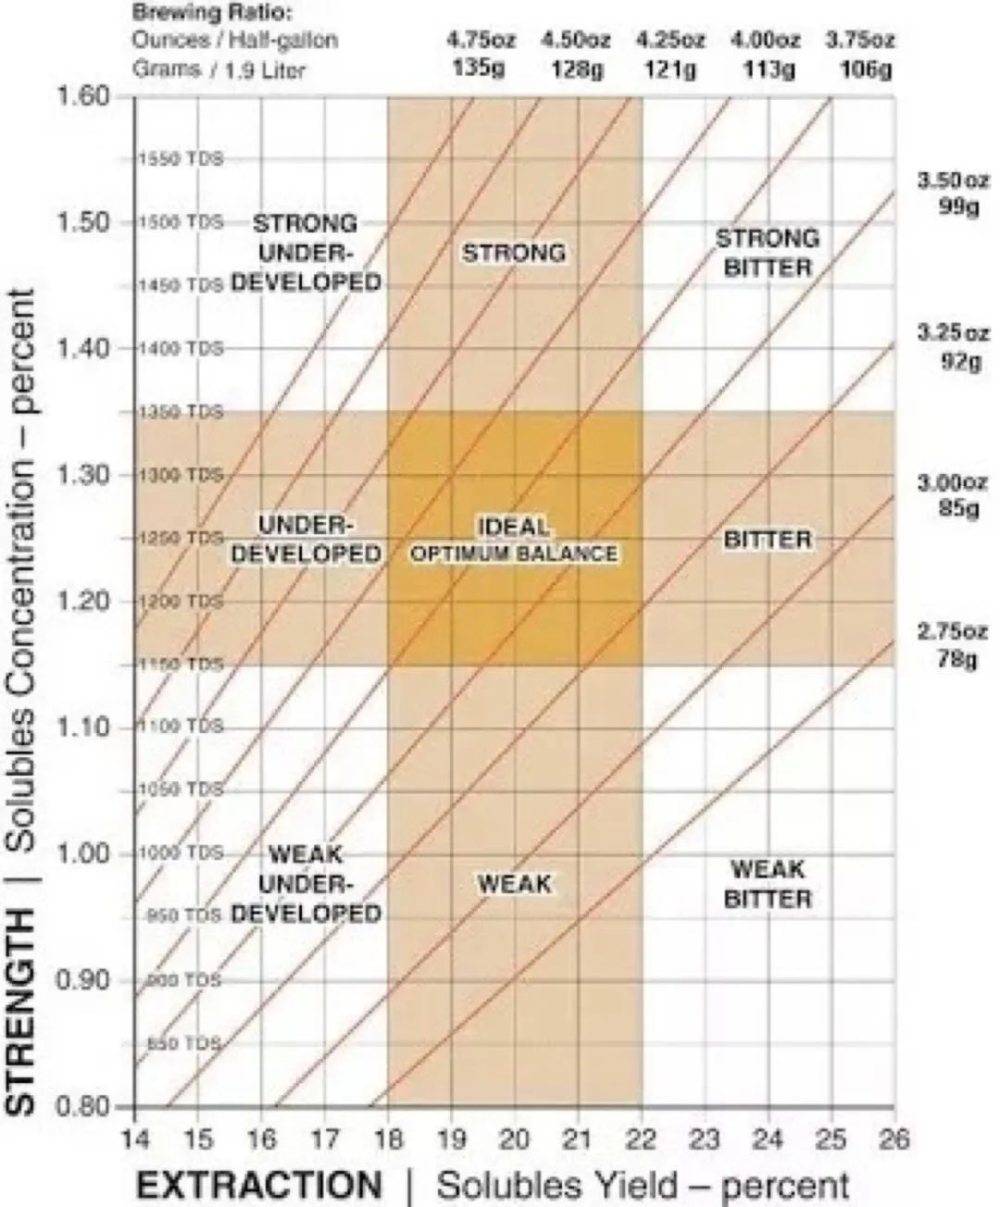
We can refer to the Golden Cup extraction chart below to understand the theory of Golden Cup extraction more intuitively.
In the chart, the horizontal axis represents extraction yield, and the vertical axis represents concentration. Concentration reflects the amount of extracted substances in a cup of coffee—the more extracted substances, the stronger the coffee; the less, the weaker. Extraction yield refers to the proportion of soluble substances extracted from coffee grounds relative to the total amount of coffee grounds. We can use a coffee concentration measuring device to read the concentration value, then apply the formula "coffee liquid volume × coffee concentration ÷ coffee grounds weight" to calculate the extraction yield.

Let's do a simple calculation: 1900ml÷135g≈14.07, which gives us the first diagonal line corresponding to a coffee-to-water ratio of 1:14.07. Following this pattern, all the way to the third diagonal line, we exactly enter the dark-colored area in the chart.
This dark-colored area represents the ideal extraction zone that a cup of coffee can achieve—what we call the Golden Cup extraction range: extraction yield between 18% and 22%, and concentration between 1.2% and 1.45%. Anything beyond this range is over-extraction, and anything below is under-extraction.
However, this chart can easily lead to a misunderstanding: that as long as you choose a coffee-to-water ratio diagonal line that falls within the Golden Cup extraction range, you will definitely brew a delicious "Golden Cup coffee."
This is not the case.
A coffee-to-water ratio that reaches the Golden Cup extraction range does not mean the brewed coffee will necessarily taste good. It is merely a reference at the data level, indicating that this coffee-to-water ratio makes it easier to brew coffee into the Golden Cup extraction range.
The significance of learning the Golden Cup extraction theory lies in using it to better understand the principles of extraction and adjust improper brewing factors, so as to brew the flavor you desire.
So do not misunderstand the core concept of Golden Cup extraction and confine yourself to the so-called golden coffee-to-water ratio.
- END - Front Street Coffee (FrontStreet Coffee)
No. 10, Bao'an Qian Street, Yandong Road, Dongshankou, Yuexiu District, Guangzhou, Guangdong Province
The above content is compiled by CoffeeHunters, a coffee news website.